Genomic inbreeding coefficient
Genomic inbreeding coefficient
The genomic inbreeding coefficient, GIC (lexicon) shows how much of the genome has 2 identical copies at a given locus because of inheritance of common ancestors of the parents. The GIC value is obtained directly from the DNA of the animal being examined and reflects the actual situation in the genome of the tested animal.
PLEASE NOTE: The inbreeding coefficient (IC) calculated traditionally from pedigree data of the last 5-6 generations is not correlated and is not suitable for accurately representing the individual inbreeding situation.
Important: GIC values depend on the resolution power of the SNP array used
Low-resolution chips produce lower GIC values. The supposedly better value does not indicate a better inbreeding situation, but is merely based on the fact that small areas of inbreeding haven't been detected.
The choice of the right array (SNP chip) depends on the animal species being studied, the inbreeding practised in breeding to date, and the size of the existing breeding stock.
Traditionally, the inbreeding coefficient was estimated using pedigree records. This method had significant limitations, primarily neglecting inbreeding events that occurred before the evaluated generations.
At Generatio, we determine the actual inbreeding status of an animal using genomic information obtained from SNP-array analysis. This advanced approach assesses the variability of an animal's genome across its species, indicating the level of inbreeding, including background inbreeding from domestication and breed development. This measure is known as the genomic inbreeding coefficient (GIC).
By using genomic data, it becomes possible to determine the genetic inbreeding status of an animal without precise knowledge of the relatedness of its parents or other ancestors. This method provides a more accurate and comprehensive understanding of an animal's genetic diversity and inbreeding level.
Assessment
The assessment must take into account the specific background of the animal being examined:
- Animals belonging to a breed that was established through inbreeding and in which inbreeding has been practised over many generations. In such populations with high average inbreeding values, individual animals may have high GIC values (>40%) and still be healthy. The reason for this is a process called “purging” that took place during the establishment of the breed.
- In animals from populations with low overall inbreeding (< 10%), GIC values above 25% would be a clear indication of very close kinship between the parents. In such populations, “incestuous matings” always lead to an increased risk of rare recessive defective alleles coming together in a homozygous form.
In general, high individual GIC values do not mean breeding restrictions. However, it is important to find a breeding partner for these animals that can balance out the inbred areas in the genome. Our mating planning tools help here, both for individual pair evaluations and for creating complete rankings of a breeding population.
Example
GIC and HE in the ATC online animal record
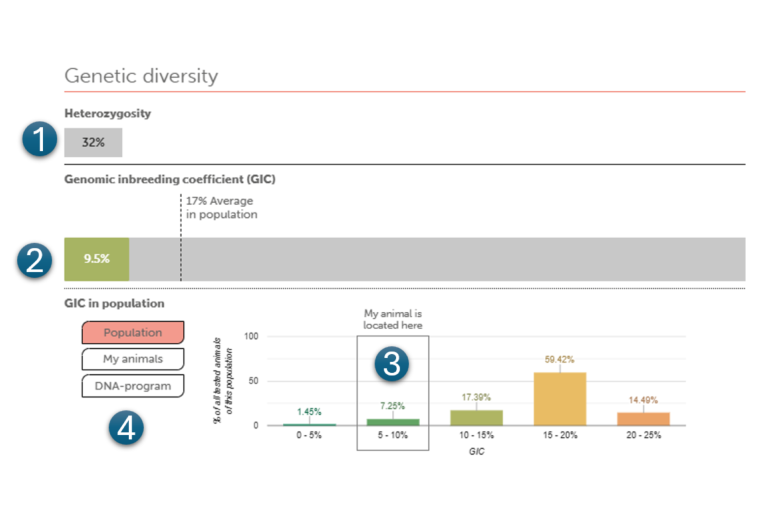
- Heterozygosity and GIC are analysed with our test for inbreeding&fitness for dogs and camels. The heterozygosity level is represented as a percentage value. Normal values fall within a specific range, while high or low values indicate special genetic diversity or inbreeding, respectively.
- The GIC is also displayed as a percentage within a colored bar. The color and length of the bar provide information about the degree of inbreeding. A green bar indicates a low value, while a red bar suggests a higher value. Values range from 0 to 50 or above are not expected. A dashed line represents the current inbreeding value of the entire population.
- The grey frame in this diagram shows the position of my animal compared to other animals in the population. In this example, my animal with a value of 9.5% is located within the secound bar, representing animals with similar values (5-10%). The colored number above the bar indicates that 7,25% of all animals in the population also have values between 5% and 10%. In the adjacent bar, which represents values from 10-20%, 17,39% of all animals in the population are located.
- The options on the left side allow me to compare my animal to other populations. "My animals" shows my animal compared to my other animals of the same breed, and selecting a DNA program shows my animal compared to animals within that group.