Using the Breed Analysis Report
Example Report
The complex situation in analysing the breed composition of a horse is best illustrated in a two-part report.
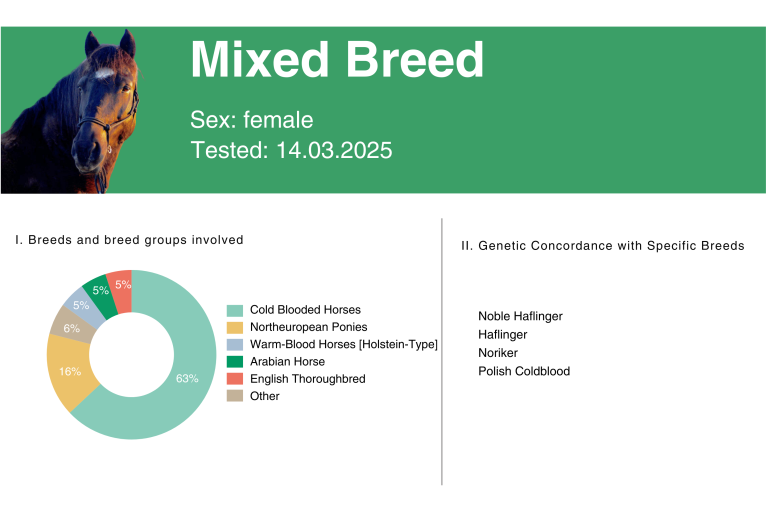
I) Identified Breeds and Breed Groups
This section of the report lists which of the distinct breeds and breed groups are present in your horse’s genome.
The proportion each contributes to the overall genetic composition is shown as a percentage in a pie chart.
You can find an overview of all included breed groups and the three distinct breeds here:
In the phylogenetic tree of horse breeds [link to dendrogram: dendrogram kommt auch noch von uns], you can see how the different breeds and breed groups are genetically related.
II) Matching Breeds – Similarity Assessment
The second part of the report shows which breeds your horse is genetically most similar to.
The most similar breed is listed at the top, followed by up to three more breeds in descending order of similarity.
For more detailed information, see:
Similarity Analysis
Please note: Horses belonging to a broader breed group may not always have their registered breed listed as the top match.
This is due to the ongoing and historical crossbreeding among many breeds within these groups.